Why Power BI is the Missing Puzzle Piece for Your Business Central Data
- Aug 6, 2025
- 4 min read
Picture this: You're sitting in yet another quarterly review meeting, frantically flipping through spreadsheets while your CEO asks pointed questions about cash flow trends. Sound familiar? You're not alone if you're running Microsoft Business Central but still wrestling with data scattered across multiple reports. The good news is that a solution is probably already in your Microsoft toolkit, waiting to transform how you see your business data.
Let's be honest about what most finance executives using Business Central are dealing with. It captures everything beautifully – your sales, inventory, financials, customer interactions – but when it comes to making sense of it all, we often find ourselves stuck in report-export-manipulate-present hell. You know the drill: export to Excel, create pivot tables, format charts, email around for feedback, then repeat the process next week.
Meanwhile, your team makes decisions based on week-old data, and that nagging feeling that you're missing something important never goes away. The data is there, but it does not speak a language that helps you act fast. There may be out-of-the-box reports in Business Central, but they sometimes feel that they are not sufficient for deeper data slicing and dicing.
Microsoft Power BI: Your Business Central data's best friend.
Here's where Power BI changes everything. Think of it as the translator between your Business Central data and your brain. Instead of drowning in numbers, you get visual stories that make sense.
Power BI doesn't just connect to Business Central. It practically reads its mind. With native connectors, your data flows seamlessly from your ERP system into interactive dashboards that update in real-time. No more waiting for month-end reports to understand what happened last quarter.
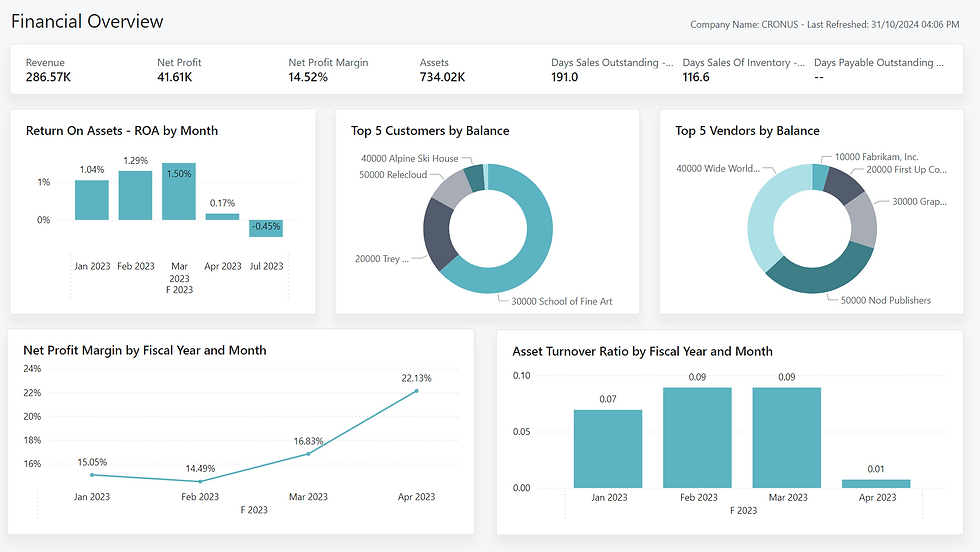
Imagine walking into Monday morning knowing exactly where your business stands. Your Power BI dashboard shows you:
Sales performance at a glance – which products are flying off the shelves, which salespeople are crushing their targets, and which regions need attention. Not in a static report, but in living, breathing visuals you can slice and dice however you need.
Cash flow that makes sense – see your accounts receivable ageing alongside payment trends, so you can spot potential problems before they become headaches. Watch seasonal patterns emerge from data that previously looked like random numbers.
Inventory intelligence – understand which items are moving fast, which are gathering dust, and what your reorder points should be based on real demand patterns, not gut feelings.
Customer insights that matter – identify your most profitable customers, understand buying behaviours, and spot opportunities for upselling or cross-selling that were invisible before.
The real magic happens in the details.
What makes Power BI special isn't just the pretty charts (though they are pretty nice). It's the way it handles the complexity of real business data. Your Business Central information rarely lives in isolation. It connects to your CRM data, marketing metrics, production systems, or e-commerce platform.
Power BI brings all these pieces together in intuitive ways. You can drill down from a high-level revenue dashboard to see precisely which customer bought which product when or zoom out to spot trends across years of data. It's like conversing with your data instead of just staring at it.
Real-time insights at your fingertips.
One of the biggest hurdles businesses face is the technical complexity of data integration. Power BI eliminates most of that friction. The Business Central connector handles the heavy lifting, and you can have meaningful dashboards running in hours, not months.
You don't need to be a data scientist to create useful visualizations. Power BI's interface is designed for business users who need answers, not IT specialists who love complexity. Drag, drop, filter, and suddenly you see patterns that are always there but never visible.
Empowering a data-driven team culture.
When your data becomes accessible and understandable, something interesting happens to your team culture. Meetings become more productive because everyone's looking at the same real-time information. Decisions get made faster because the supporting data is not buried in someone's email folder.
Your finance team stops spending hours preparing reports and starts spending time analyzing what the numbers actually mean. Your sales team can see their performance trends and adjust their approach in real-time. Your operations team can spot inefficiencies before they become expensive problems.
Getting started without the overwhelm: Integrating Power BI with Business Central
The beauty of Power BI with Business Central is that you don't have to boil the ocean on day one. Start with the reports you already create manually every week. What takes you hours in Excel might take minutes in Power BI, and once it's set up, it updates automatically.
Begin with your most painful reporting process, maybe monthly sales analysis or inventory turnover reporting. Get that working smoothly, let your team experience the difference, and then gradually expand to other areas.
And if you still find that overwhelming, a Power BI specialist like Systema Solutions is here to help you make sense of your data. Whether you're just starting or looking to take your analytics to the next level, we’ve got you covered:
Custom Reporting. We design visuals that reflect what you need to see such as KPIs, trends, variances, and more.
Training & Enablement. We don’t just build reports. We train your team to own them.
Ongoing Support. We’re here when you need tweaks, new visuals, or help understanding the data.
So, is Power BI the missing piece?
Your Business Central data holds the answers to some of your most pressing business questions. But without the right lens, those answers stay hidden. Power BI is that lens. It’s the missing puzzle piece that brings everything into focus so you can run your business with confidence, clarity, and agility.
When Power BI and Business Central work together, you stop reacting and start anticipating. From spotting cash flow issues early to identifying your most profitable products, the power to make smarter decisions is finally in your hands.
And with Systema Solutions as your partner, you don’t have to figure it all out alone. Contact us today to get started with Power BI.


Comments