New Features in Power BI Wave 2 2022
- Apr 21, 2023
- 1 min read
The latest release of Microsoft Power BI with Wave 2 2022 is packed with new features and capabilities, and if you want to learn more and know how to use them, you have come to the right place!
Jump to the specific feature you want to check out by expanding the topics below.
Power BI Premium
Automated migration experience from Azure Analysis Services to Power BI Premium.
This new capability in Power BI makes it easy for users to migrate their existing Azure Analysis Services (AAS) models to Power BI Premium. This feature is designed to simplify the migration process and reduce the time and effort required to move from AAS to Power BI. One of the key benefits of this automated migration experience is that it preserves the structure and content of the original AAS model, including data sources, tables, relationships, and measures. This means you can migrate your existing AAS model to Power BI Premium without losing your existing work or functionality. In addition, the migration process also creates a detailed report that outlines any issues or warnings that need to be addressed before the migration is complete. TO USE THIS FEATURE You must have an existing Azure Analysis Services model and a Power BI Premium workspace. Once you have these, you can initiate the migration process using the Power BI Premium web portal. The migration process involves a few simple steps, such as selecting the AAS model you want to migrate, specifying the destination workspace in Power BI Premium, and choosing the appropriate migration settings.
Power BI Premium
Query Scale-out.
This new feature in Power BI Premium allows users to run large queries in parallel, increasing the speed and efficiency of data processing. This feature enables users to split large queries into smaller, more manageable pieces and then execute them in parallel across multiple nodes in a Power BI Premium cluster.
TO USE THIS NEW FEATURE
To use Query Scale-out, you must have a Power BI Premium workspace and a Power BI Premium capacity with multiple nodes. Once you have these, you can configure Query Scale-out for your data models using the Power BI Premium web portal.
Power BI Pro
Relationship editing in the properties pane.
Relationship editing in the properties pane is a new feature in Power BI Pro that provides users with a more streamlined and efficient way to manage relationships between tables in a data model. This feature allows users to create, modify, and delete relationships directly from the properties pane without navigating to a separate relationship view.
TO USE THIS FEATURE
To use relationship editing in the properties pane, you must have a data model with multiple tables and existing relationships between them. Once you have this, you can access the properties pane for a table and view its relationships.
From here, you can add new relationships between tables by selecting the appropriate tables and fields and specifying the type of relationship (such as one-to-many or many-to-many). You can also modify existing relationships by changing the fields or the relationship type and deleting no longer needed relationships.
To explore all the relationship choices, simply click any relationship line in the modelling view after expanding the properties pane. By having no data preview and only validating after you apply changes, this new relationship editing experience sends a few queries. As previously, you may double-click any line in the properties pane to get the relationships dialogue for editing if necessary. It also makes it possible to edit several relationships at once. When adjusting several relationships, hold down CTRL while doing so, or use your keyboard's delete key to remove the relationships you've selected.
Replace Get data experience in the Power BI service.
This new feature in Power BI Pro allows users to easily update and replace data sources in their Power BI reports and dashboards. This feature simplifies the process of updating data sources, especially in scenarios where data sources have been moved or renamed.
TO USE THIS FEATURE
To use the Replace Get data experience, you need to have an existing report or dashboard in Power BI that uses a data source that needs to be updated. Once you have this, you can access the Replace Get data experience by selecting the ellipsis (...) menu for the data source in the Fields pane and selecting the "Replace current data source" option.
From here, you can select the new data source you want to use, which can be a different data source or a modified version of the existing data source. You can then choose to update the report to use the new data source, which will automatically replace all instances of the old data source in the report.
Create submetrics that roll up to the metric.
This new feature in Power BI Pro allows you to create rollup submetrics based on existing metrics and then roll them up to a higher-level metric. This feature is particularly useful when you want to break down a metric into smaller, more specific components and then roll them up to a summary metric.
TO USE THIS FEATURE
You first need to have an existing metric in your report that you want to break down into submetrics. You can then create submetrics by selecting the metric and choosing the "Create submetric" option from the context menu. From here, you can create new metrics that are based on the original metric, but with different filters, groupings, or calculations applied to the data.
Optimize ribbon in Power BI Desktop.
You may now utilize the brand-new Optimize ribbon, which features stop visual queries and optimization presets. You can pause visual queries if you want to add or remove field list items from a visual without having the visual update. Moreover, you can reload a single image without reloading the entire page.
Improve My workspace governance.
Service administrators will be better able to control My workspace by:
Changing their status as an administrator of My workspace. Service administrators can set up My workspace in a way that complies with data residency requirements.
For each environment in My workplace, they can specify a preset Premium capacity.
My workplace owners are unable to return their areas to common use.
The contents of a user’s My workspace are private by default. Only if the My workspace owner has a Pro or Premium Per User subscription and elects to do so, may it be shared with others. Only Power BI service admins can perform this action, and access is automatically revoked after 24 hours.
Improvements to download Power BI for large models.
This new Power BI feature allows users to more efficiently download and work with larger datasets. It is particularly useful for those who work with large and complex data models, such as those that involve millions of rows or many interconnected tables.
TO USE THIS FEATURE
You need to have a large data model in your Power BI report that you want to download. You can then use the new download options to choose which parts of the model you want to download. This includes options such as selecting specific tables, columns, or data types to download.
Once you have selected your download options, you can then initiate the download process, which will download the selected data to your local machine. You can then use this downloaded data to analyse and create visualizations, even when offline or working with slow internet speeds.
Enable large datasets.
This new feature in Power BI lets you work with larger datasets than was previously possible in the service. This feature is particularly useful for those who work with large and complex datasets, such as those that involve millions of rows or many interconnected tables.
TO USE THIS FEATURE
Create a model in Power BI Desktop if your dataset will become larger and progressively consume more memory.
Publish the model as a dataset to the service.
In the service > dataset > Settings, expand Large dataset storage format, set the slider to On, and then select Apply.
Invoke a refresh to load historical data based on the incremental refresh policy. The first refresh could take a while to load the history. Subsequent refreshes should be faster, depending on your incremental refresh policy.
Set default storage format.
This new feature allows users to specify the default storage format for new tables that are created in their dataset. This can help ensure that data is stored in the most appropriate format for a given use case, improving the performance and efficiency of data analysis.
TO USE THIS FEATURE
In the workspace, select Settings > Premium.
In Default storage format, select Large dataset storage format, and then select Save.
Support single visual embedding in PowerPoint.
Live Power BI charts can be inserted into PowerPoint slides. Users can interact with these live charts by filtering the data using the visual's filters, and they are automatically updated with the most recent data from Power BI.

Mobile visual formatting.
Creating views of report pages that are suitable for viewing on mobile devices requires the usage of Power BI's mobile layout view. Both Power BI Desktop and the Power BI service offer a mobile layout view.
HOW TO OPEN MOBILE LAYOUT VIEW IN POWER BI DESKTOP Select the View ribbon and choose Mobile layout.

HOW TO OPEN MOBILE LAYOUT VIEW IN POWER BI SERVICE
Choose Edit report > Mobile Layout. If the Edit option isn't visible, look under More options (...).

Subscribe to reports, slicers applied.
By choosing this option, any modifications you have made to the filters, slicers, personalized visuals, cross-filtering or cross-highlighting, drill down or drill up, and the spotlight will be reflected in the report view that is sent to your email.

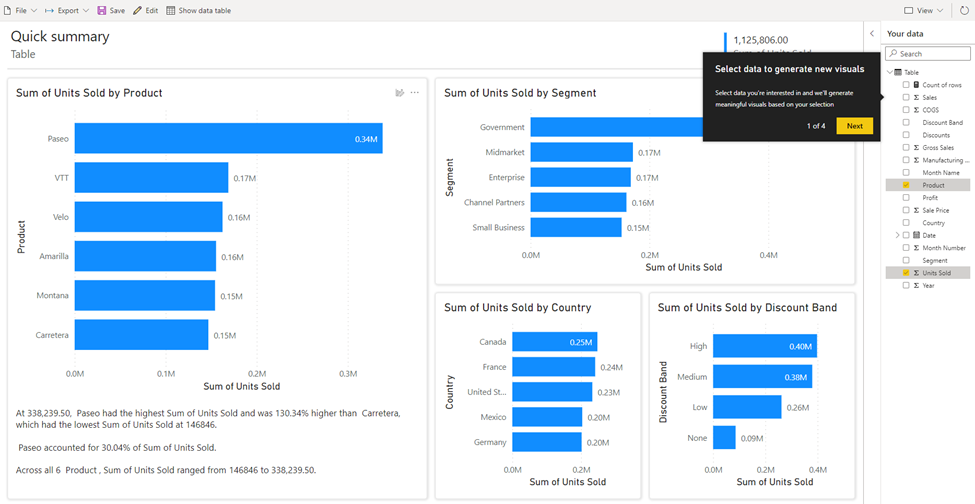
Create quick reports on datasets with multiple tables.
The Power BI service offers a number of quick report creation options. You can paste data directly into Power BI on the web, and Power BI will create graphics for you without you having to download the Power BI Desktop program and import the data.
Create a quick report.
In the navigation pane in the Power BI service, you can select the Create button that opens a page where you can select your data source. It's also accessible from the New report button on Home.
Currently, we only support creating a report based on an existing dataset or pasting or manually entering data directly in a table. Over time you'll see other options, such as uploading an Excel file.
When you choose to paste or manually enter data, a grid appears that you can type into. You can also paste data by using Ctrl + V or the context menu.

You can use the context menu to add and remove columns. If your pasted data includes a header row, select Use first row as headers to automatically promote the first row to the header row. Power BI automatically detects the data types, but you can set them manually. Select the Data type button next to the column name.

As you go through the creation process, Power BI creates a new dataset for you and autogenerates a summarized view of your data. These autogenerated visuals propel you from raw data to insights faster than ever.
Create exportable formatted data tables.
Unlike Report Builder, which requires you to build your output first and then display it, this experience uses Power BI datasets and lets you alter the finished product. Even styling is an option. The styling is kept when you export the data.
In Data hub view, select More options (…) next to a dataset > Create formatted table.
Or if you click on a dataset, Select As formatted table.
Create a table.
To create your first table, select fields names in the Fields pane on the right. This pane gives you a table-and-column based view of the chosen dataset. When you find a column that you wish to add to your table, select the column or drag it into the pane labelled Build.

The Build pane has other customization options for you to create a better looking table. To access these options, select the Format tab at the top of the Build pane.
On the File menu, save, download, or print your report.
On the Export menu, choose the file format you prefer.
Which of these features are you most excited about? Let us know in the comments below.
Need help creating custom reports and analyses in Power BI? We can help. Learn how here.


Comments